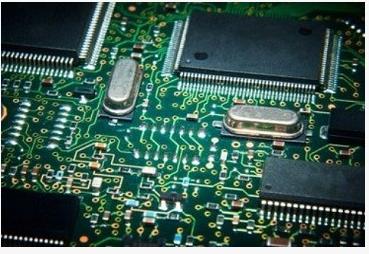
The impedance and loss of PCB are very important for the transmission of high-speed signals, and are also the key to the quality assurance of PCB factories. In order to analyze such a complicated transmission channel, we can study its impact on the signal through the impulse response of the transmission channel.
The impulse response of the circuit can be obtained by transmitting a narrow pulse. The ideal narrow pulse should be a narrow pulse with infinitely narrow width and very high amplitude. When this narrow pulse is propagated along the transmission line, the pulse will be expanded. The shape of the expanded pulse is related to the response of the line. Mathematically speaking, we can convolve the impulse response of the channel with the input signal to get the waveform of the signal after transmission through the channel. The impulse response can also be obtained from the step response of the channel. Since the differential of the step response is the impulse response, the two are equivalent.

It seems that we have found a way to solve the problem, but in real situations, ideally narrow pulses or infinitely steep step signals do not exist. Not only are they difficult to generate, but the accuracy is not easy to control, so more in actual testing. The ground is to use a sine wave to test to obtain the frequency domain response, and to obtain the time domain response through the corresponding physical layer test system software. Compared with other signals, sine waves are easier to generate, and its frequency and amplitude accuracy are easier to control. The vector network analyzer (VNA) can accurately measure the reflection and transmission characteristics of the transmission channel to different frequencies through a sine wave sweep in the frequency range of up to tens of GHz. The dynamic range is more than 100dB, so modern high-speed When analyzing the transmission channel, a vector network analyzer is mainly used for measurement.
The reflection and transmission characteristics of the system under test for sine waves of different frequencies can be expressed by S-parameters. S-parameters describe the transmission and reflection characteristics of sine waves of different frequencies. If we can obtain the reflection and transmission characteristics of the transmission channel for sine waves of different frequencies, theoretically we can predict the impact of the real digital signal after passing through this transmission channel, because the real digital signal can be considered to be caused by the frequency domain. It is composed of many sine waves of different frequencies.
For a single-ended transmission line, it contains 4 S parameters: S11, S22, S21, S12. S11 and S22 reflect the reflection characteristics of sine waves of different frequencies from port 1 and port 2 respectively, S21 reflects the transmission characteristics of sine waves of different frequencies from port 1 to port 2, and S12 reflects from port 2 to port 1. The transmission characteristics of sine waves of different frequencies. For differential transmission lines, since there are 4 ports in total, the S-parameters are more complicated, with a total of 16 ports. Under normal circumstances, a vector network analyzer with 4 ports or more is used to measure the differential transmission line to obtain its S parameters.
If the 16 S parameters of the tested differential line are obtained, many important characteristics of the differential line have been obtained. For example, the SDD21 parameter reflects the insertion loss characteristic of the differential line, and the SDD11 parameter reflects its return loss characteristic.
We can further obtain more information by doing inverse FFT transformation on these S parameters. For example, the time domain reflection waveform (TDR: Time Domain Reflection) is obtained by transforming the SDD11 parameters. The time domain reflection waveform can reflect the impedance change of the measured transmission line. We can also perform inverse FFT transformation on the SDD21 result of the transmission line to get its impulse response, thereby predicting the waveform or eye diagram of digital signals with different data rates after passing through the pair of differential lines. This is very useful information for digital design engineers.
It can be seen that the vector network analyzer (VNA) is used to measure the transmission channel of digital signals. On the one hand, it draws on the analysis methods of radio frequency and microwave, and can obtain very accurate transmission channel characteristics in the frequency range of tens of GHz; on the other hand, On the one hand, by performing some simple time-domain transformations on the measurement results, we can analyze the impedance changes on the channel, the impact on the real signal transmission, etc., so as to help digital engineers in the early stage to determine the backplane, cable, The quality of the connectors, PCB circuit boards, etc., without having to wait for the final signal to have a problem before rushing to deal with it.